• Improve efficiency in a specific process?
• Increase accuracy in Predict?
• Minimize costs or maximize profits?
• Enhance decision-making for a particular metric?
Understanding your target outcome helps us tailor the model to your needs, whether it’s for binary classification (like predicting a good or bad outcome) or regression tasks (like forecasting a continuous value). Once we define the outcome, we’ll proceed with data preparation and model training to deliver the insights you’re looking for.
• Target Outcome Variable: This is the column in your dataset you want to predict (e.g., 'DefaultFlag' for loan default prediction).
• Target Outcome Improvement: This is the desired percentage improvement in the target variable, within -20% to +20% (e.g., -10 for reducing defaults by 10%).
• Target Variable Type: Specify whether the target variable is 'Categorical' or 'Numerical'.
• Good Outcome: The label representing a positive or desirable outcome in your target variable (e.g., 'Not Default').
• Bad Outcome: The label representing a negative or undesirable outcome in your target variable (e.g., 'Default').
• Good Outcome Value: The numerical value for the good class (e.g., 0 if 'Not Default' is considered positive).
• Bad Outcome Value: The numerical value for the bad class (e.g., 1 if 'Default' is considered negative).
• Target Outcome: Attrition
• Good Outcome: No
• Bad Outcome: Yes
• Good Outcome Value: 0
• Bad Outcome Value: 1
• Target Outcome Type: Categorical
• Target Outcome Improvement: - 20%
• Target Outcome Improvement Status: in range
• All variables are complete. Model execution will now begin.
Introduction:
In this exploratory data analysis, we delve into the relationship between the SXI Score and the target feature, Attrition. The SXI Score serves as a benchmark for assessing the likelihood of Attrition, with a current score of 0.9 and an associated outcome percentage of 16.12%. The goal is to achieve a 10% reduction in Attrition, aiming for a target outcome of 14.51%.
Observations:
• Higher SXI Scores tend to correspond to a higher likelihood of Attrition with a 'Yes' outcome.
• Lower SXI Scores are more indicative of a 'No' outcome for Attrition.
Hypothesis :
The SXI Score can effectively classify the Attrition outcomes into 'No' and 'Yes' categories based on the observed patterns in the data.
Differentiation between Outcomes:
The data indicates that as the SXI Score increases, the probability of 'Yes' Attrition also increases. This is evident from the instances where higher SXI Scores align with 'Yes' outcomes. Conversely, lower SXI Scores are associated with 'No' outcomes, showcasing the predictive power of the SXI Score in distinguishing between the two outcomes.
Conclusion:
The SXI Score demonstrates a strong potential for predicting Attrition outcomes, with higher scores indicating a higher likelihood of 'Yes' Attrition. By leveraging this predictive power and aiming for a target improvement to reduce Attrition to 14.51%, strategic interventions can be implemented to achieve this goal effectively.
Attrition Rate and SXI Score Analysis Report
Summary Analysis:
- Current Attrition Rate: 16.12% (237), indicating a decrease for the target outcome 'Attrition' with an immediate target outcome of 14.51%.
- SXI Score Correlation: Currently SXI score at 0.9, with an R-squared value of 0.97, demonstrating a positive correlation. This emphasizes the role of the SXI score in influencing the attrition rate.
Analysis Structure:
- Immediate Term: Achieving a 10% decrease in attrition reduces the count by 24, aligning with a target SXI score of 0.88. This phase focuses on swift, practical measures for immediate benefits.
- Mid-Term Improvements: A 50.5% decrease in attrition equates to a reduction of 120, with a targeted SXI score of 0.699. This phase involves moderate adjustments for sustained progress.
- Long-Term Success: A 90.63% decrease in attrition results in a reduction of 215, targeting a significantly improved SXI score of 0.52. This phase demands comprehensive, transformational changes to achieve lasting improvements.
The data highlights that lowering the SXI score directly correlates with improved attrition rates, providing a clear, actionable roadmap for success.
Interpretation and Significance:
The metrics of attrition rate and SXI score play a crucial role in evaluating the model's performance and shaping actionable strategies for organizational improvements. A lower attrition rate signifies better employee retention and organizational stability.
The positive correlation between SXI score and attrition rate emphasizes the importance of employee satisfaction, engagement, and well-being in reducing attrition.
By understanding the relationship between these metrics, organizations can develop targeted strategies for immediate, mid-term, and long-term improvements. The structured analysis provides a roadmap for implementing practical measures, making moderate adjustments, and driving transformative changes to achieve lasting success.


Performance Evaluation Report: SXI Model
Summary of Evaluation Metrics:
Model Accuracy: 94%
Precision Score: 94%
Area Under the Curve (AUC): 0.96
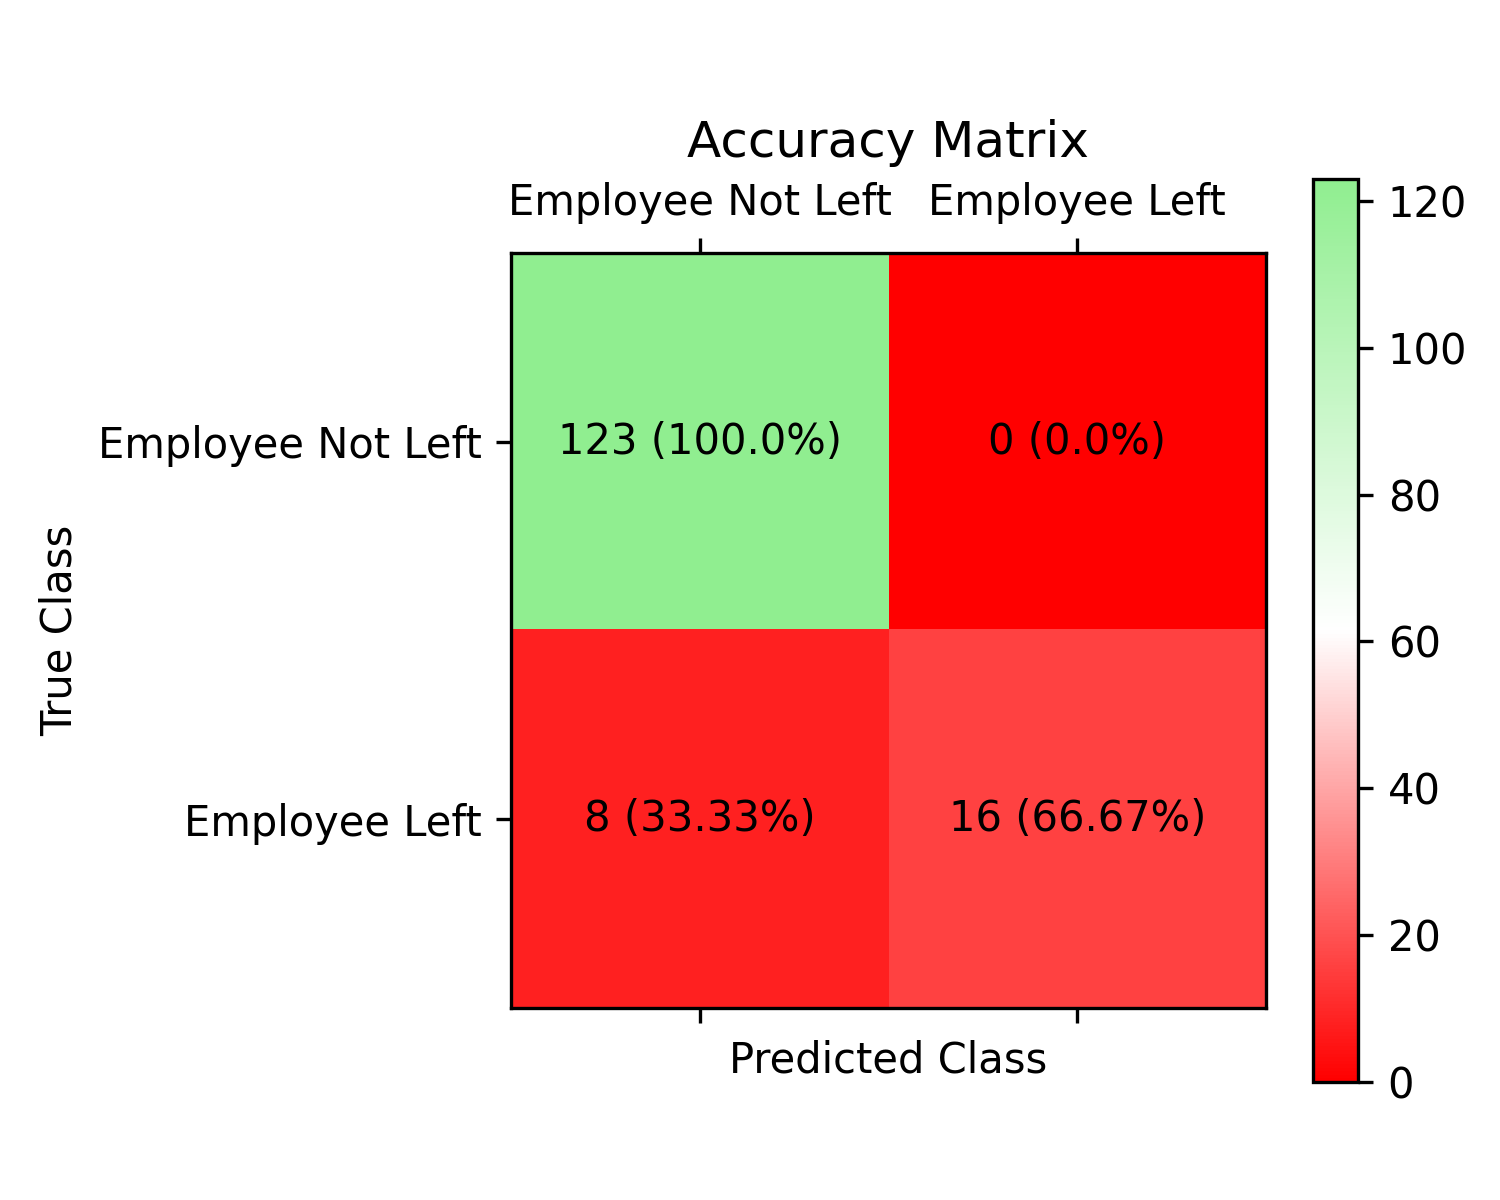
Accuracy Matrix :
True Negatives (TN): 123
False Positives (FP): 0
False Negatives (FN): 8
True Positives (TP): 16
Interpretation of Metrics:
Model Accuracy (94%):
This metric indicates that the model correctly predicted the outcome 94% of the time. A high accuracy score suggests that the model is performing well in classifying the data points correctly.
Precision Score (94%):
Precision measures the proportion of true positive Predict out of all positive Predict made by the model. A precision score of 94% indicates that when the model predicts a positive outcome, it is correct 94% of the time.
Area Under the Curve (AUC) (0.96):
The AUC is a metric used to evaluate the overall performance of a classification model. A high AUC score of 0.96 suggests that the model has a strong ability to distinguish between the positive and negative classes.
Accuracy Matrix :
The Accuracy Matrix provides a detailed breakdown of the model's Predict:
True Negatives (TN): 123 instances were correctly predicted as negative.
False Positives (FP): 0 instances were incorrectly predicted as positive.
False Negatives (FN): 8 instances were incorrectly predicted as negative.
True Positives (TP): 16 instances were correctly predicted as positive.
Overall Assessment:
The SXI model demonstrates high accuracy, precision, and AUC scores, indicating its effectiveness in making accurate Predict and distinguishing between different classes. The model's ability to minimize false positives and false negatives, as shown in the Accuracy Matrix , further strengthens its performance evaluation.
Further analysis and validation on larger datasets or through cross-validation techniques can provide additional insights into the model's robustness and generalizability.
Actual vs Predicted
| EmployeeNumber | Actual | Predicted |
|---|---|---|
| 966 | Employee Stayed | Employee Stayed |
| 1263 | Employee Stayed | Employee Stayed |
| 762 | Employee Stayed | Employee Stayed |
| 262 | Employee Stayed | Employee Stayed |
| 1784 | Employee Stayed | Employee Stayed |
| 1968 | Employee Left | Employee Left |
| 343 | Employee Stayed | Employee Stayed |
| 77 | Employee Stayed | Employee Stayed |
| 1070 | Employee Stayed | Employee Stayed |
| 1762 | Employee Stayed | Employee Stayed |

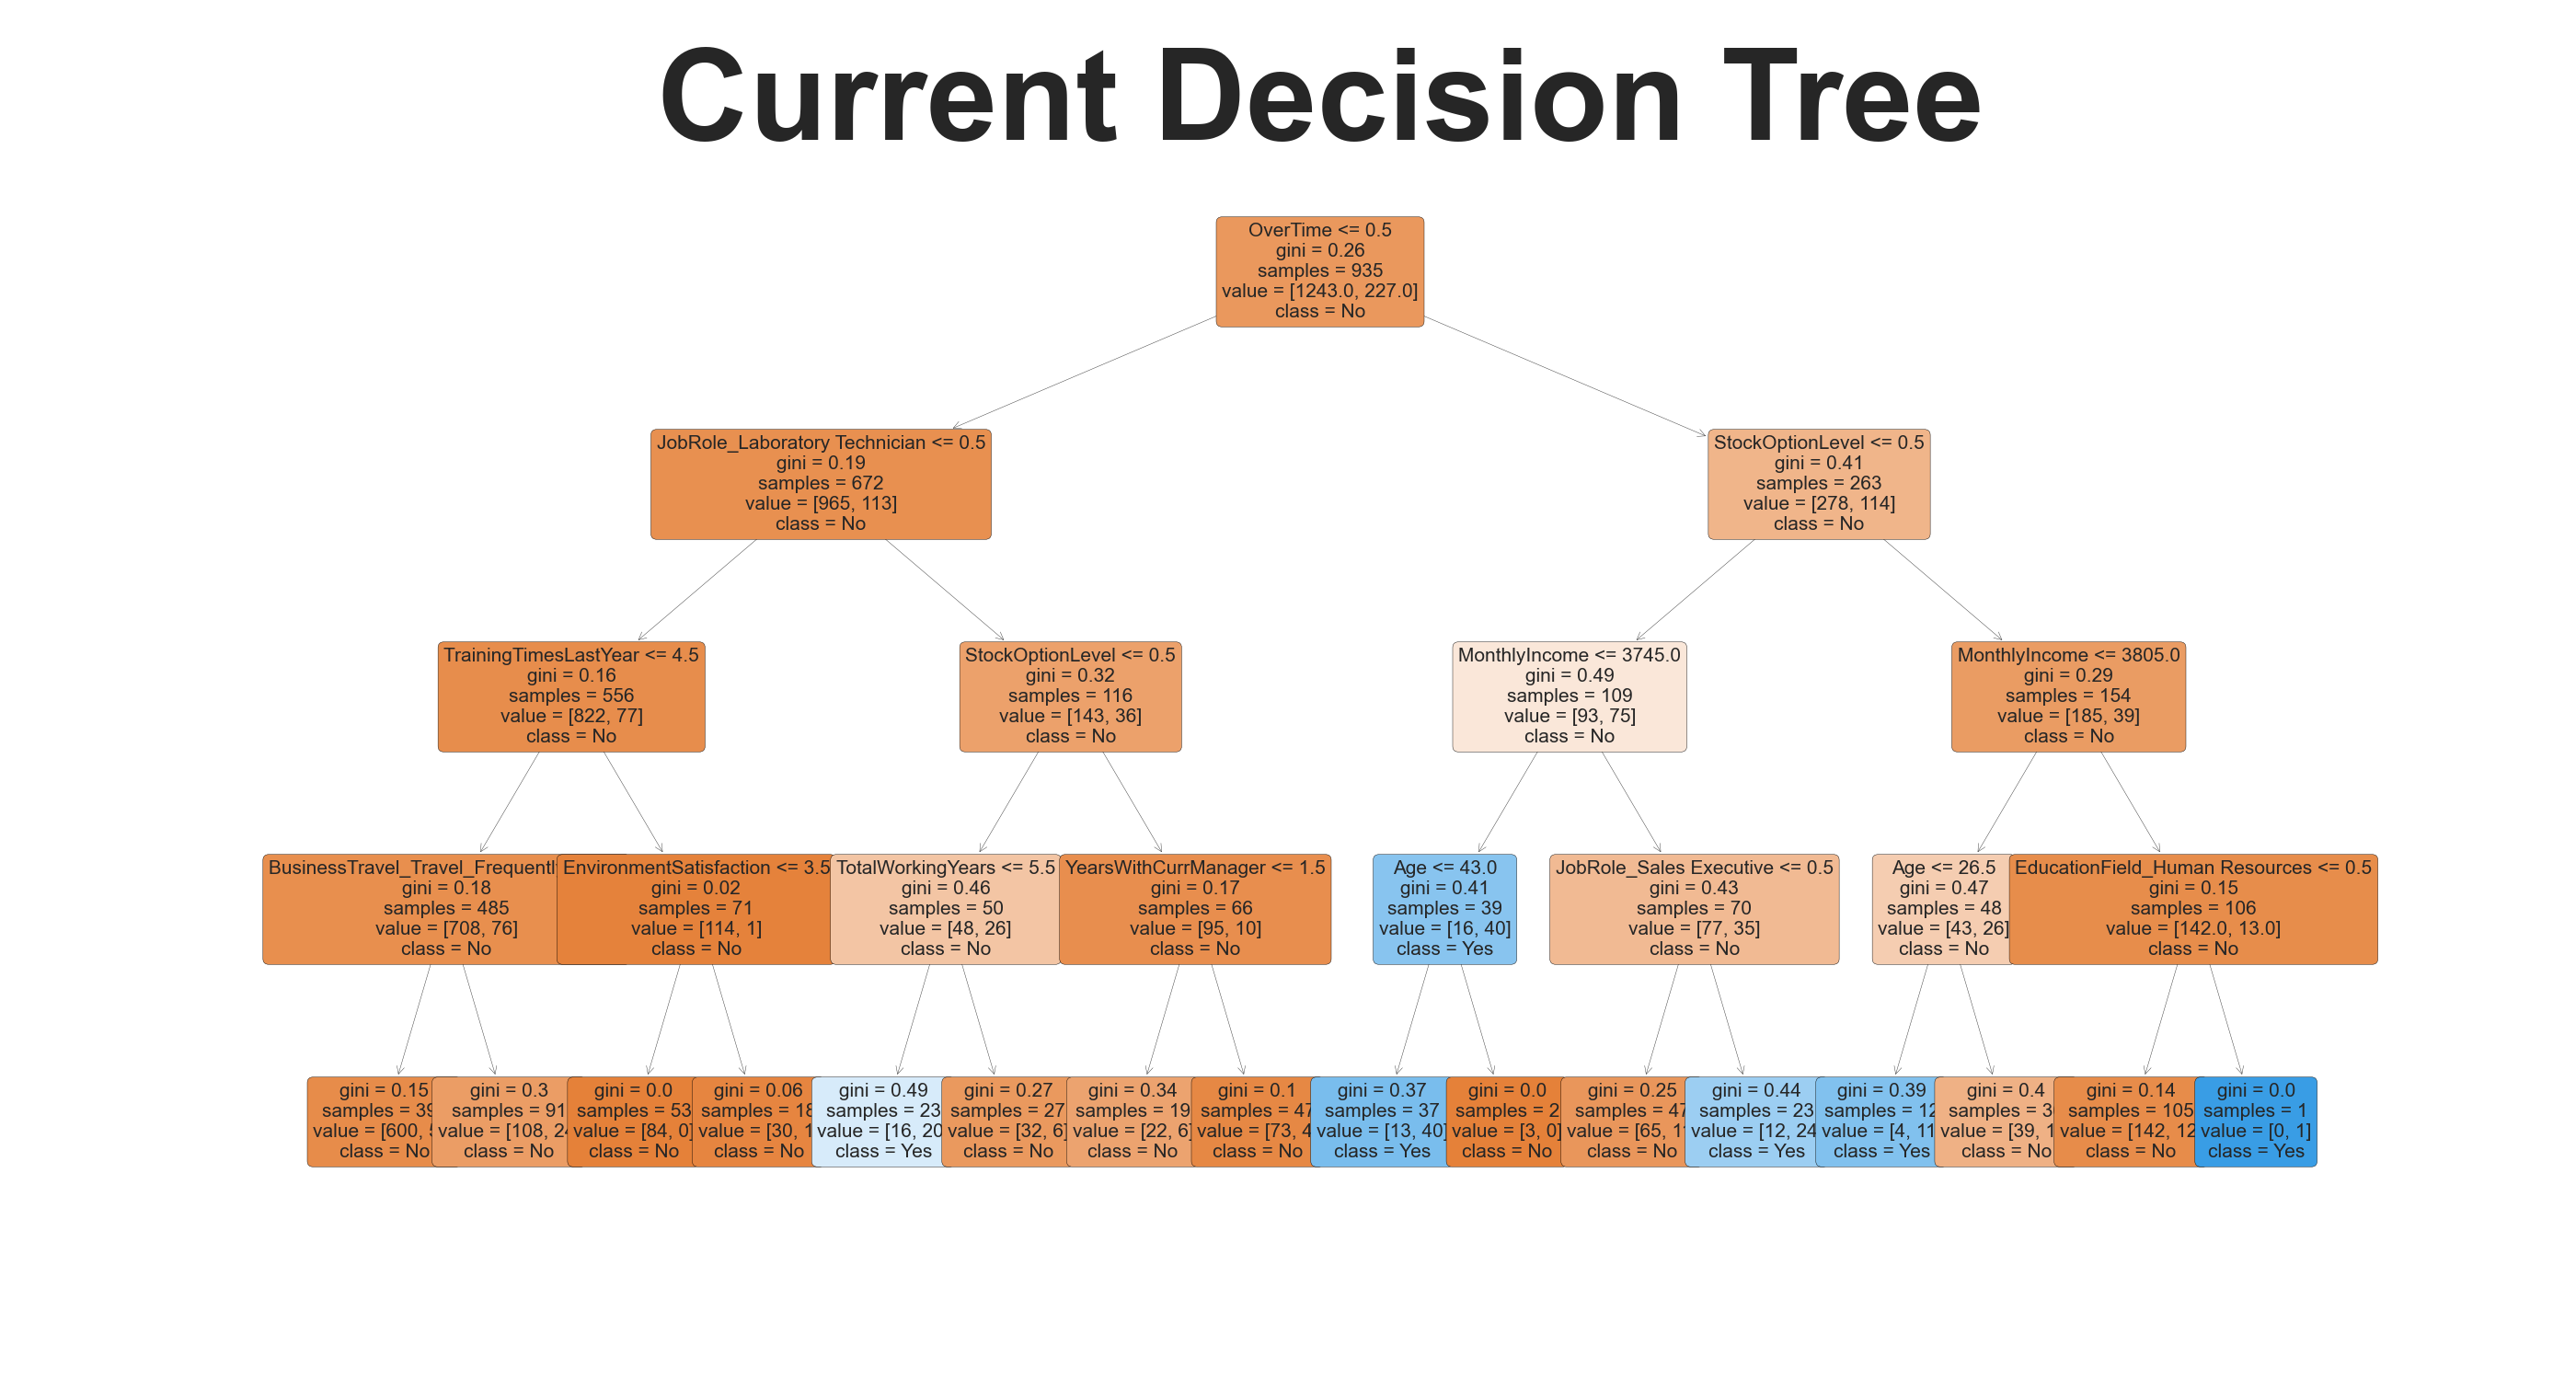
Path Identified for Attrition: No
- OverTime <= 0.5
- JobRole_Laboratory Technician <= 0.5
- TrainingTimesLastYear <= 4.5
- BusinessTravel_Travel_Frequently <= 0.5
- EnvironmentSatisfaction <= 3.5
- StockOptionLevel <= 0.5
- TotalWorkingYears > 5.5
- YearsWithCurrManager <= 1.5
- JobRole_Sales Executive <= 0.5
- MonthlyIncome > 3745.0
- Age > 43.0
- MonthlyIncome > 3805.0
- Age > 26.5
- EducationField_Human Resources <= 0.5
Path Identified for Attrition: Yes
- StockOptionLevel <= 0.5
- TotalWorkingYears <= 5.5
- MonthlyIncome <= 3745.0
- Age <= 43.0
- JobRole_Sales Executive > 0.5
- MonthlyIncome <= 3805.0
- Age <= 26.5
- EducationField_Human Resources > 0.5
Explanation of how the SXI algorithm identified the important features:
The SXI algorithm determined feature importance by calculating the contribution of each feature to the model's predictive power. Features with higher scores are considered to have a greater influence on the decision-making process of the model. For instance, "MonthlyIncome" (20.67) and "StockOptionLevel" (20.34) received the highest scores, indicating they play significant roles in predicting attrition outcomes. Conversely, "EnvironmentSatisfaction" with a score of 0.05 shows minimal significance in influencing decisions.
Explanation of the accuracy of the threshold values:
The thresholds set in the decision tree directly correlate with the associated probabilities for “No” and “Yes” classifications. For example, the highest probability for a "No" outcome occurs with "OverTime <= 0.5" at 92.02%, while the highest probability of "Yes" is 75.47% when the conditions for "StockOptionLevel", "MonthlyIncome", and "Age" are met. This illustrates that many branches leading to "No" outcomes have probabilities exceeding 80%, confirming solid thresholds for classification. However, the probabilities for "Yes" outcomes are generally lower, reflecting the inherent uncertainty and challenge in classifying positive outcomes accurately under the present feature values.
Reliability of the thresholds:
The reliability of thresholds can be considered high for the "No" outcomes given the significantly higher probabilities (92.02% and above). In contrast, the thresholds leading to "Yes" outcomes exhibit less reliability due to lower probabilities, indicating that while these thresholds provide some guidance, they may not be as robust for conclusive Predict. Proper calibration and validation using real-world data would be necessary to ensure these thresholds maintain their predictive accuracy across different scenarios.

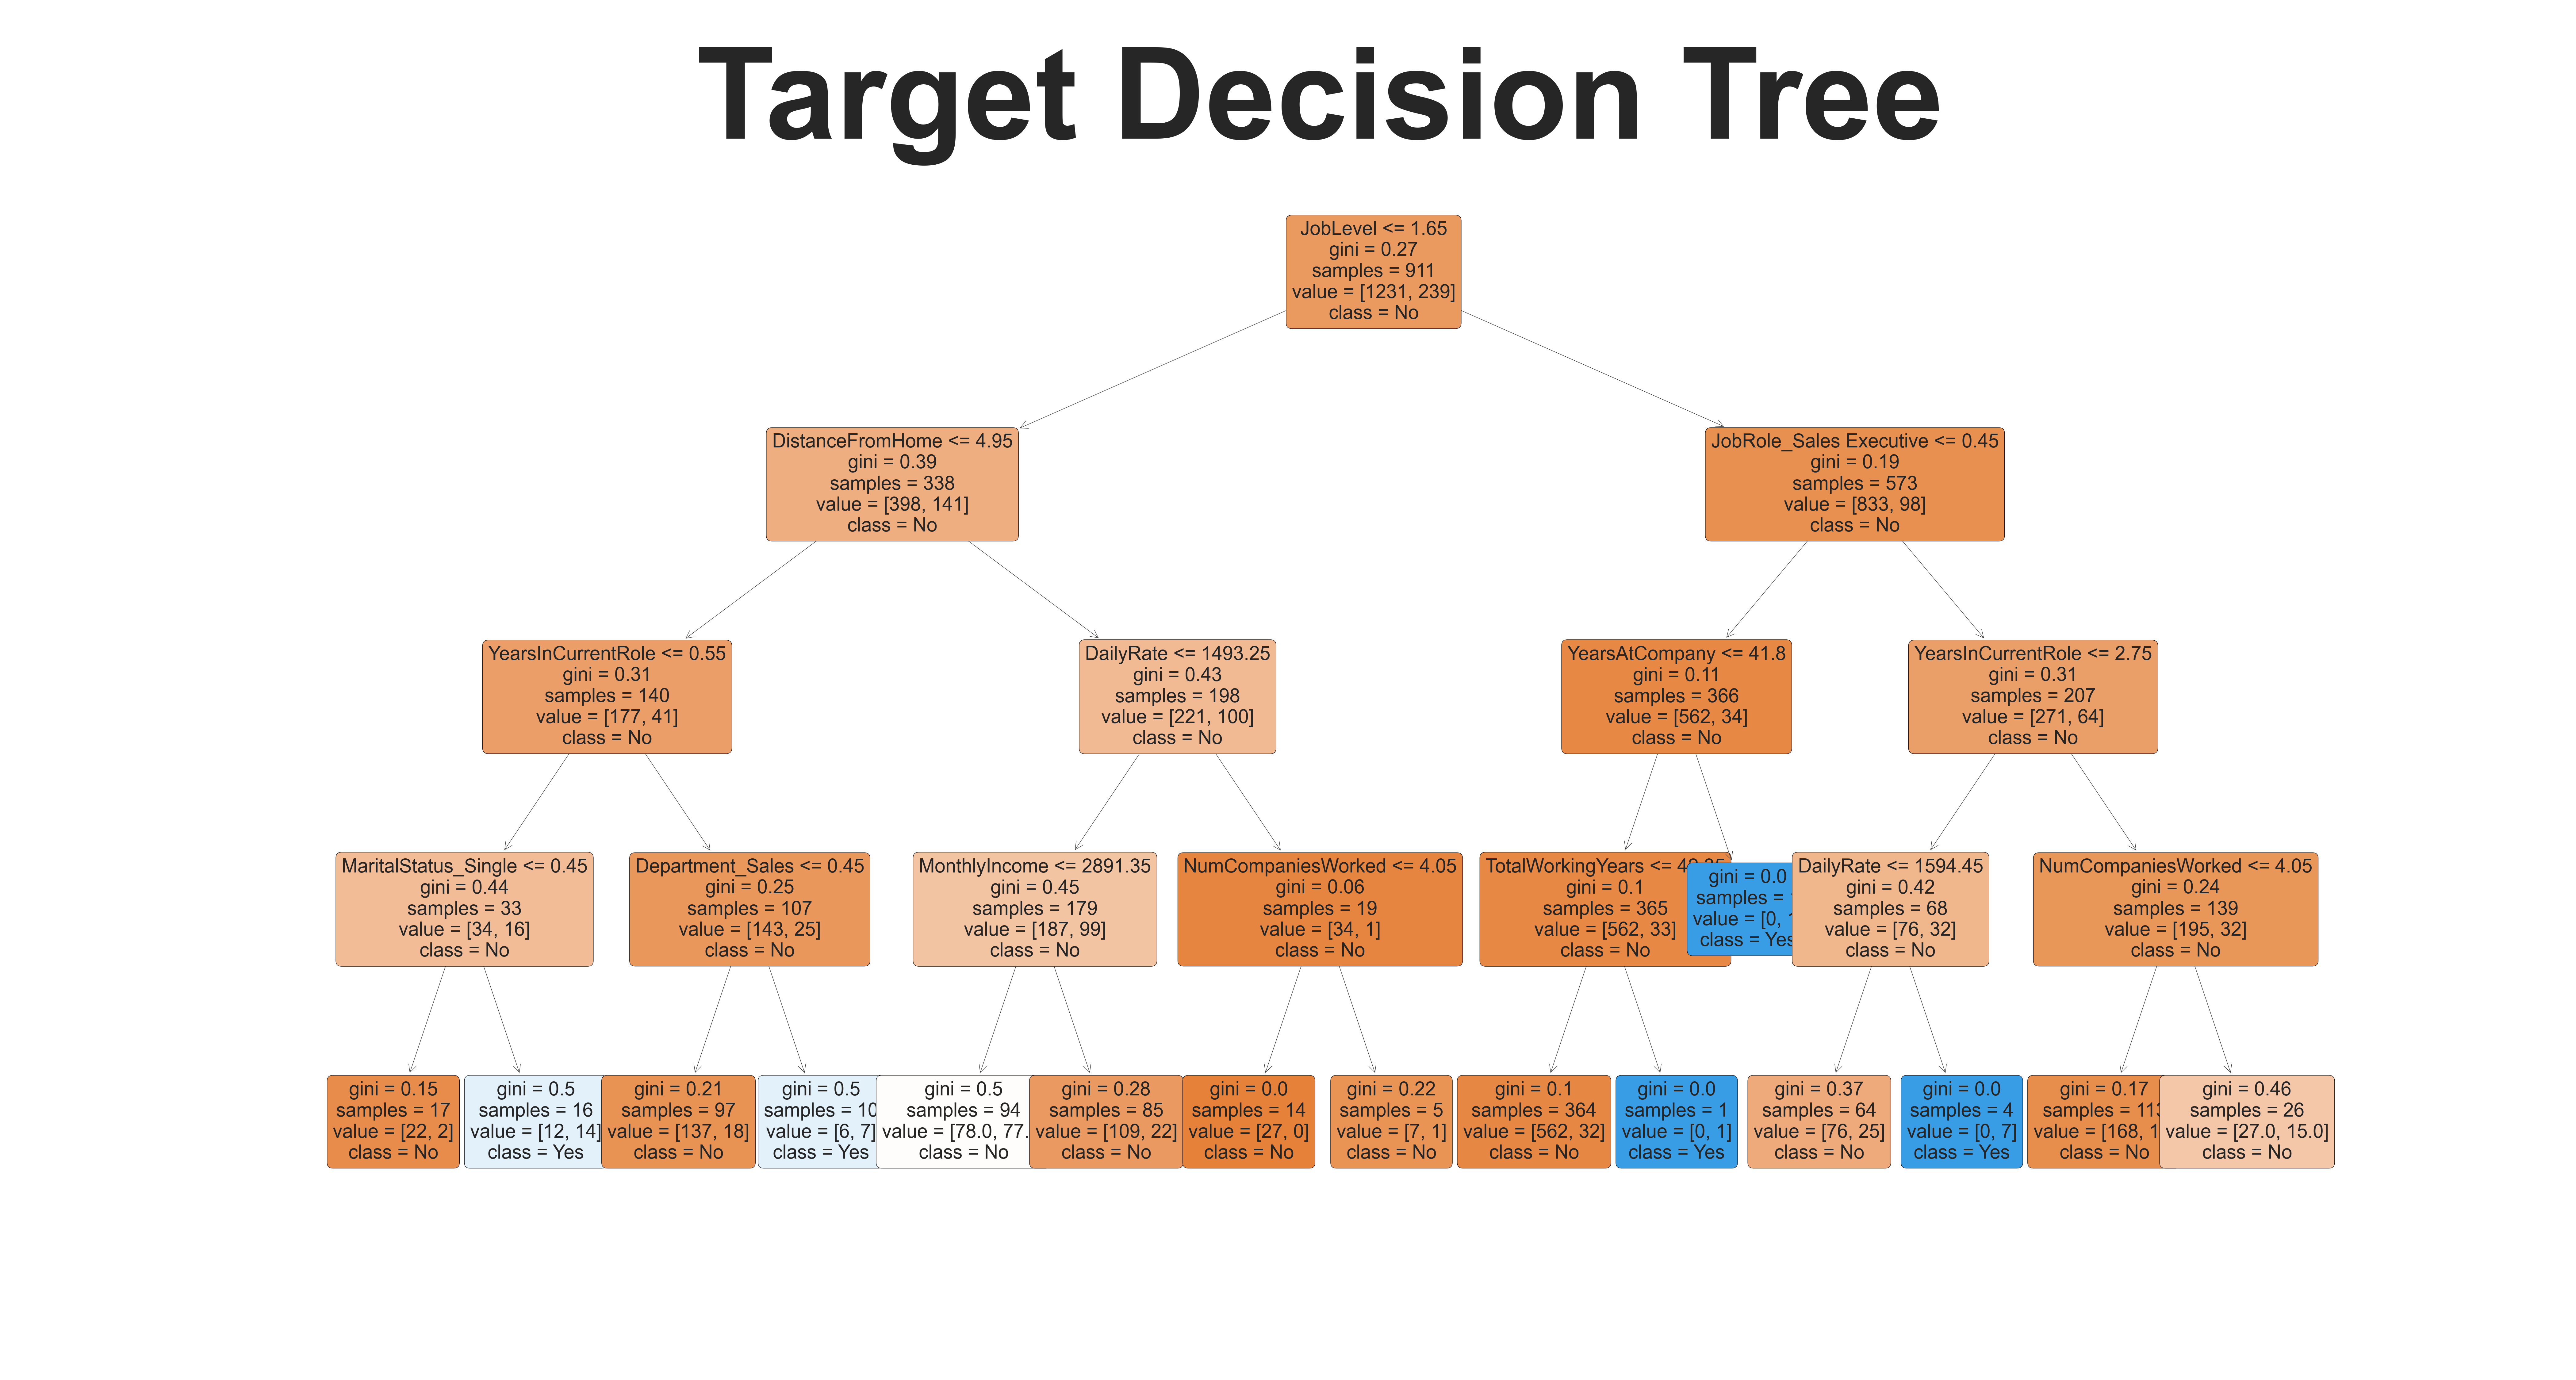
Path Identified for Attrition: No
- JobLevel <= 1.65
- DistanceFromHome <= 4.95
- YearsInCurrentRole <= 0.55
- MaritalStatus_Single <= 0.45
- Department_Sales <= 0.45
- DailyRate <= 1493.25
- MonthlyIncome <= 2891.35
- NumCompaniesWorked <= 4.05
- JobRole_Sales Executive <= 0.45
- YearsInCurrentRole <= 2.75
- NumCompaniesWorked <= 4.05
Path Identified for Attrition: Yes
- JobLevel > 1.65
- DistanceFromHome > 4.95
- YearsInCurrentRole > 0.55
- MaritalStatus_Single > 0.45
- Department_Sales > 0.45
- DailyRate > 1493.25
- MonthlyIncome > 2891.35
- NumCompaniesWorked > 4.05
- JobRole_Sales Executive > 0.45
- YearsInCurrentRole > 2.75
Explanation of how the SXI algorithm identified the important features:
The feature importance scores indicate how impactful each feature is in determining the model's Predict. The SXI algorithm evaluates the contribution of each feature to the model's accuracy during training. The features with higher scores, such as JobLevel (20.54), MonthlyIncome (18.9), and DailyRate (16.87), are considered more influential in classifying outcomes. In this model, it suggests that JobLevel is significantly decisive when predicting attrition outcomes compared to features with lower scores, like DistanceFromHome (4.87) and Department_Sales (5.27).
Explanation of the accuracy of the threshold values:
The thresholds in the decision tree represent critical cut-off points where the classification changes from "No" to "Yes" or vice versa. Each feature's value is checked against its threshold to decide the final prediction. For instance, a Probability of 91.67% for "No" indicates that the model is quite confident in this prediction when JobLevel <= 1.65, DistanceFromHome <= 4.95, YearsInCurrentRole <= 0.55, and MaritalStatus_Single <= 0.45. Similarly, for the "Yes" class, where probabilities are 53.85% or lower, the thresholds at which these classifications switch indicate less confidence. Thus, the accuracy of these thresholds can be understood through their associated probabilities, highlighting where certain thresholds yield high certainty for a "No" or "Yes" outcome.
Reliability of the thresholds:
The reliability of the thresholds is key to ensuring the model's Predict remain robust across different scenarios. High probabilities for the "No" classification show strong reliability, with the decision tree providing clear pathways leading to "No" outcomes. In contrast, the lower probabilities associated with "Yes" classifications suggest a potential for misclassification, especially in regions where the model is less certain. This uncertainty emphasizes the need for further validation and potential refinement of the thresholds to improve classification accuracy in practical applications.

Auto-ML Model Performance Report
Introduction:
This report presents an evaluation of an AutoML model created using the Decision Tree algorithm. The purpose is to assess the model's performance based on various metrics.
Evaluation Metrics:
Model Accuracy: 85.00%
Precision Score: 46.30%
Area Under the Curve (AUC): 0.69
Accuracy Matrix Breakdown:
The Accuracy Matrix provides a detailed breakdown of the model's performance. It includes:
True Negatives (TN): 231
False Positives (FP): 22
False Negatives (FN): 22
True Positives (TP): 19
Interpretation:
The model achieved an accuracy of 85.00% and a precision score of 46.30%, indicating that it correctly classified instances with moderate precision. The AUC score of 0.69 suggests reasonable performance in distinguishing between classes. However, the low precision score indicates a higher rate of false positives, which may need further optimization.
Conclusion:
The AutoML model based on the Decision Tree algorithm shows promising results with an accuracy of 85.00% and an AUC of 0.69. However, improving precision to reduce false positives could enhance the model's performance further.